US COMMODITIES CORNER
Cheese price 'escalation' drives April Class III milk price increase
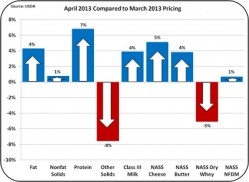
On 1 May 2013, Class and Component Prices for April were announced. It was a generally favorable month with cheese and butter driving up milk protein and fat prices, as well as Class III milk prices.
As will be discussed, the potential international shortage of cheese and butter is causing speculators to bid up current and future values of dairy products.
US Department of Agriculture (USDA) National Agricultural Statistics Service (NASS) cheese prices, which have the greatest influence on Class III pricing, are now seeing significant escalation.
The CME prices lead the NASS prices by about two weeks and are showing even greater strength.
All long term trends continue, with protein being the most valuable component and other solids maintaining its higher than historical value.
Protein was up the most to $3.01 per pound (lb) and butterfat went up to $1.82 per lb - both excellent prices. Other solids dropped slightly to $0.39 per lb.
With the increase in protein, the breakdown of the Class III price slightly increased the proportion attributed to protein.
In April, from the total of $17.59 per hundredweight (cwt), $8.01 per cwt was from protein.
2012 US milk production
Dairy production data for 2012 for the U.S. is now available.
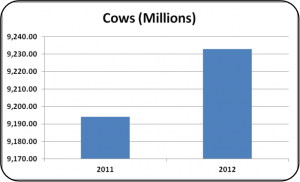
Milk production was up 2.1% while the number of lactating cows increased only 0.6%. Milk per cow increased by 1.6% to 1847 lbs per cow annually.
Component percentages increased again in 2013 with increases of 0.01% in both butterfat and protein.
Butterfat averaged 3.71% and protein averaged 3.09%.
The mix of payment from year to year is illustrated in the chart below.
Protein continues to dominate the financial value of milk, and other solids has increased consistently represent over $2.00 per cwt.
The price of other solids is based on the dry whey price which has increased as demand has increased, driven by the export market.
When 2011 is compared to 2012 by payment type, California payment system stayed at 21% of the total U.S. milk production.
The big increase came from a shift to unregulated milk pricing.
This has occurred because the geographic areas where milk pricing is not regulated has grown, and in areas like Wisconsin many plants have elected to be removed from the Federal Milk Marketing Order program.
In Wisconsin, 80% of the milk is used in cheese.
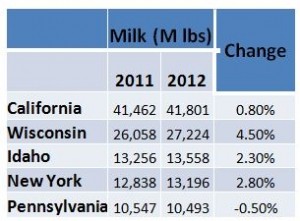
Geographically, the five largest producing states remained the same. The largest increase occurred in Wisconsin which had a 4.5% increase in milk production.
Dairy exports expanded again in 2012 in all categories. Nearly 50% of the nonfat dry milk and dry whey are exported.
US-based John Geuss is the editor of US dairy commodities blog, MilkPrice.
For more of John's in-depth month-to-month dairy commodity price updates, click here.


